Logging and debugging in JavaScript. A few methods I use on a daily basis.
A few methods I use on a daily basis.
I wrote this article to share a few debugging and logging methods I tend to use on a daily basis. I hope that at least some of them aren’t as popular as console.log, at least among the ones that just begin their journey with JavaScript.
1. console.log()
I think the console.log method is pretty straight forward. However, if you’re new to web development, here is a quick description. The console.log method is probably the most used utility developers use to debug their JavaScript. You can pass an object, string, number, array etc. as an argument and it will print its value to the console available in most modern browsers.
💡 Tip #1: When logging arrays, we can use the spread operator, so we don’t need to click the array in console.
Code example
|
|
Above code example would print the following output into the console.

The console.log trap
console.log can sometimes be deceiving. What I mean is that what you see in the console can be something you wouldn’t expect it to be. Consider the following code:
|
|
What you would probably expect to see in the console is the first object containing the name “Teddy” and the second with the name “Bearnard”. Let’s see:

It seems right, but wait. Let’s expand the objects:

What?! 🤨
Told you — console.log can sometimes be deceiving. What happend here is quite easy to understand and also quite easy to forget about. The console.log method uses the value in the collapsed version and a reference to object when expanded.
Stylish console.logs
Printing values to console is really useful, but the .log() method can do much more cool stuff. It takes a formatting string as a first argument, so you can place a %c operator and pass a string with CSS styles as a second argument. This way you can make the values more visible, or display a message to users who are accessing the console on your production site (just like Facebook does).
💡Tip #2: You can use console.clear() in code to be sure that the message is printed at the top of the console.
Code example
|
|
Following code will generate:

Facebook console example:

2. Use debugger and feel like an embedded developer
What if you don’t want to put console.logs everywhere? You can use the debugger.
It is a great tool that you can use to stop the execution of the script on certain lines (just like with breakpoints). You can place the debugger keyword inside of your code, for example inside of function and the context of the method will be available in the javascript console in your browser. You’ll also be able to see the values of variables available in the scope, step over to another function call, resume the execution and so on. Having some experience with debugging the STM32 C and Assembly code I must admit that using the debugger feels simmilar (ten thousand times faster with all the hot reloading magic, but still simmilar).
It needs some getting used to, though.
Example - debugger basics
Let’s say you have a function in your code which looks like this:
|
|
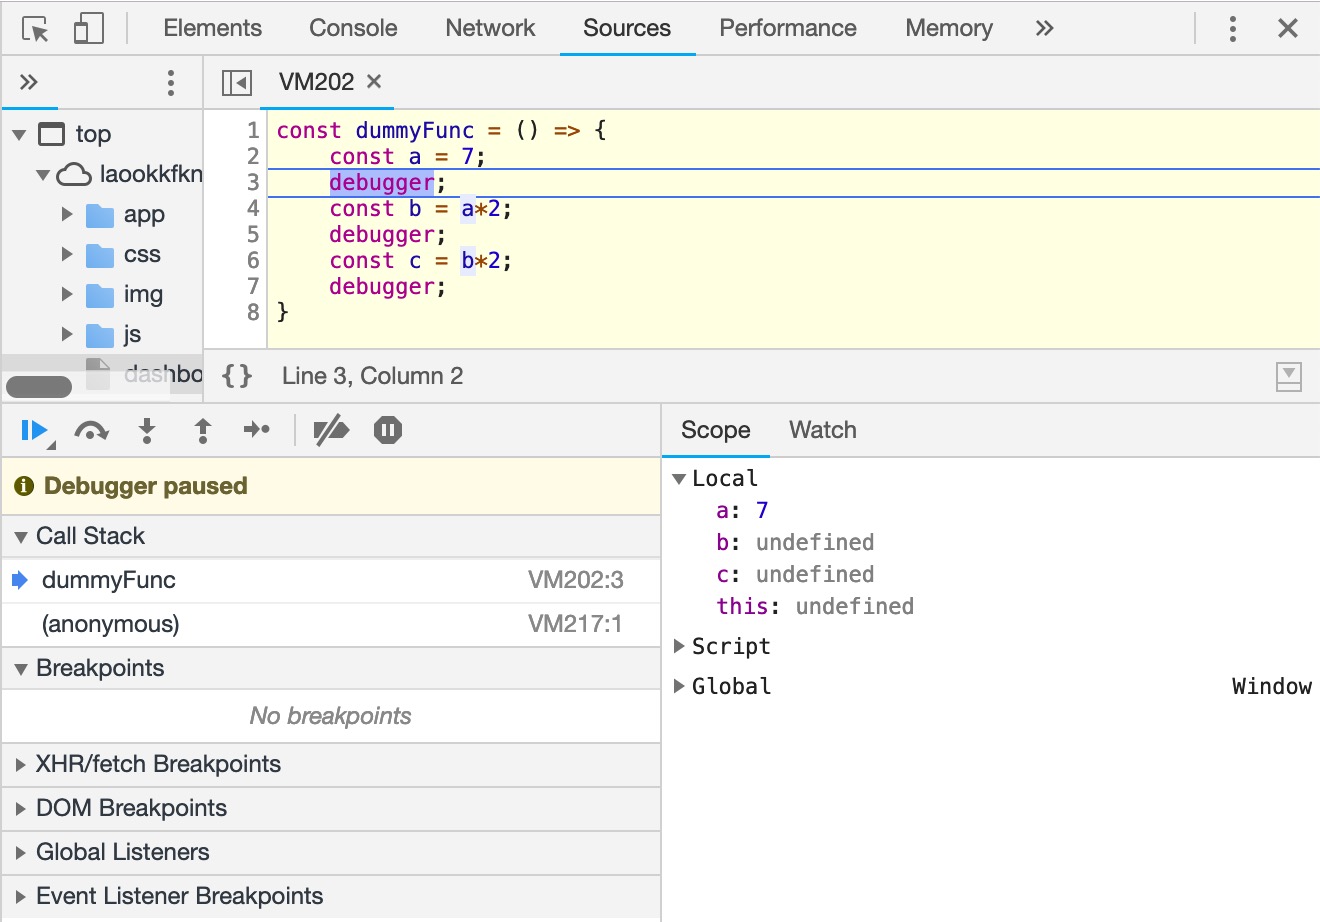
After running your code, Chrome will stop the execution of the code on the first debugger. It will act like a breakpoint. It will also automatically open the “Sources” tab for you. There are a few useful things hidden inside.

The window on the top obviously shows the code that is running. We need it to keep track of where we are at the moment.
Below the code, we can see a Scope/Watch window. It is used to observe the values of our local variables as well as the ones from the global object (Window in my case).
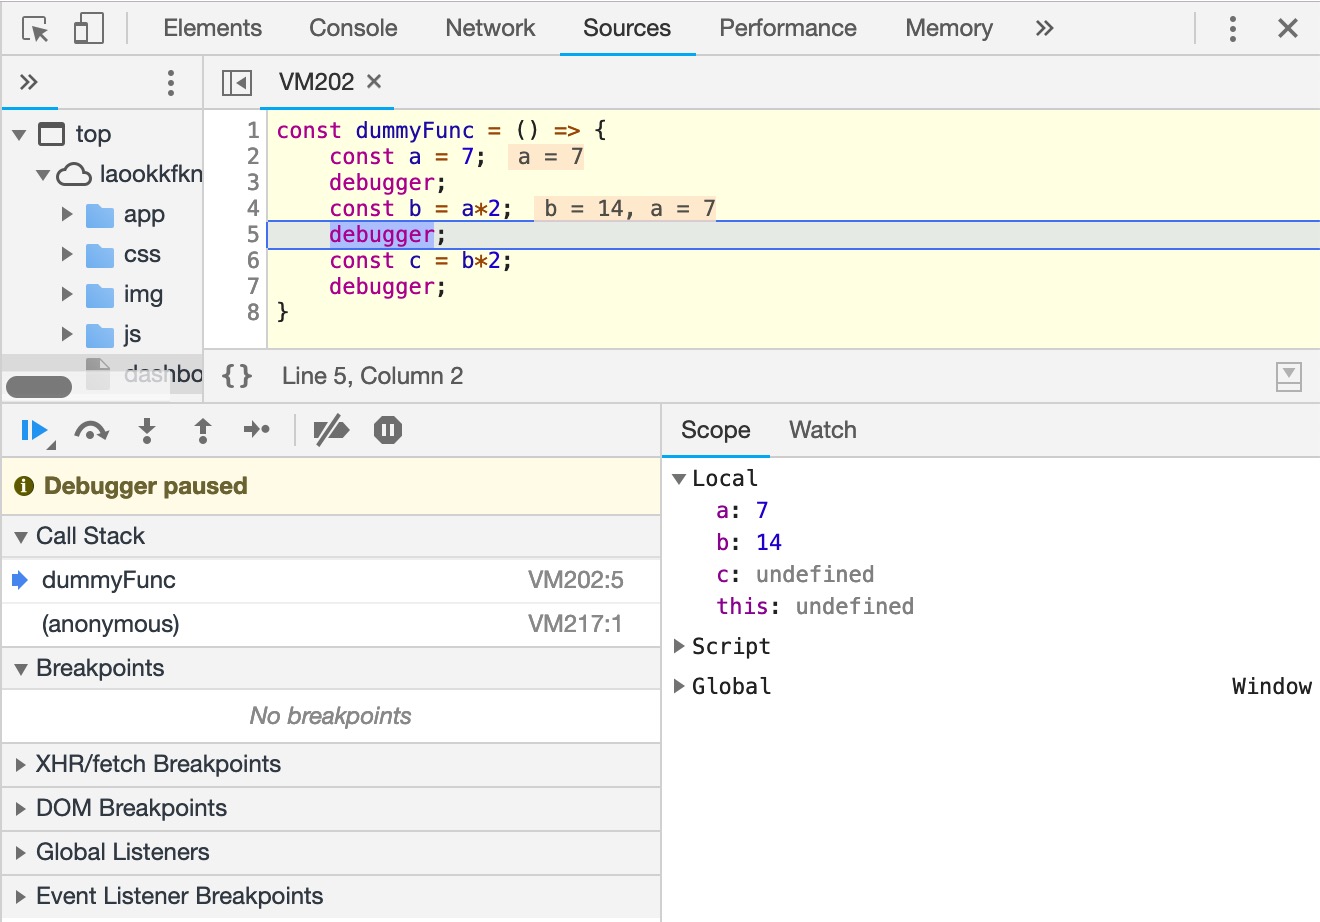
After clicking Resume Script Execution button the code will start to run and pause on the second debugger.

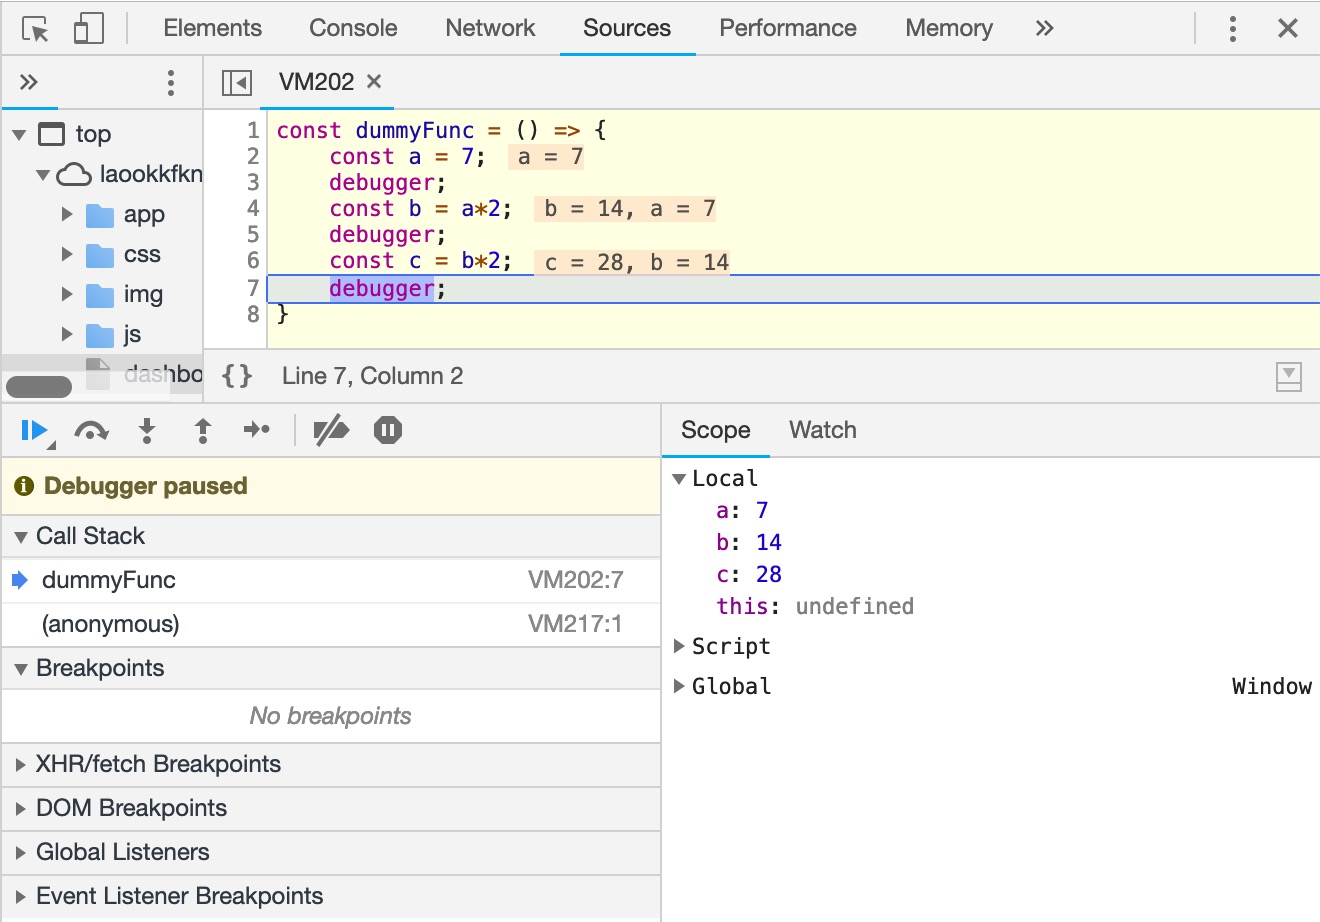
Now we can see that the variables did update.

The Watch window allows us to watch specific variables during the execution of the script.
3. console.assert()
You can use console.assert() to make assertions inside your code. It is really useful when you need to check whether some condition occurs and you don’t want to go through a list of true/false values or put additional “ifs” only to debug the app. Using console.assert you can just throw a message when the assertion method returns false.
Caution: Keep in mind that falsy assertion in Node.js < v10.0.0 will throw an AssertionError and pause the execution of your app.
Code example
|
|
4. console.count()
If you don’t know this one and you develop React apps, you definitely should try it. console.count() method logs the number of times it was called. This function takes an optional string type argument which will be its title. In case you don’t provide the argument, it will display a message like “default -
Code example
|
|
This leads us to why I think you should know this method. It enables you to easily count the number of renders of each component you use. Of course, you can use a package for that, but if you’re a #BundleSizeFreak then Tip #3 is for you.
💡Tip #3: You can simply put a console.count() inside of component’s render method and it will let you know if your components doesn’t re-render unnecessarily.
5. Turbo Console Log

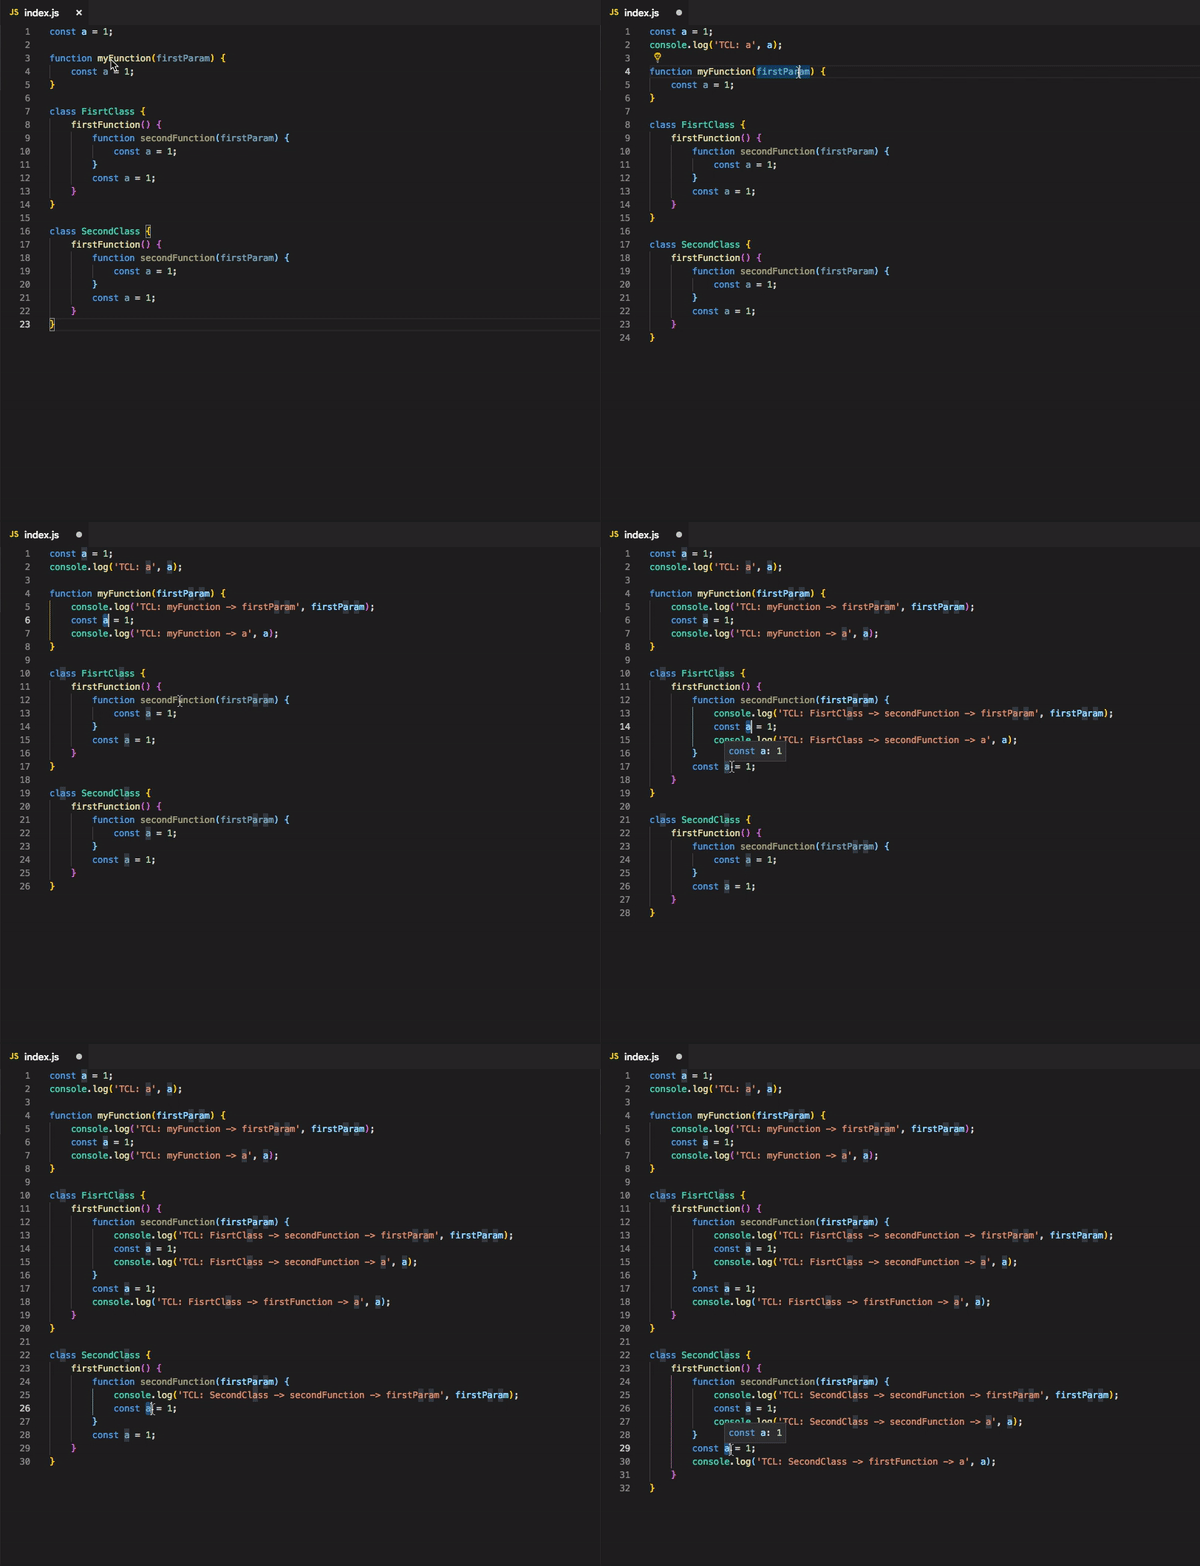
Unfortunately, this is not one of the methods from chrome’s console (it would look really cool though — this.turboConsoleLog) but it is a great extension available to download from the VSCode Marketplace. If you’re using VSCode like I do, you should really check it out. It enables you to log a variable by selecting it and pressing ctrl+alt+L. You can also configure it with a few settings:
- Log message prefix — this one is great! You can provide an emoji (like the one on the picture below) and the log will instantly become more visible in the console.

- Wrap log message — instead of providing an emoji at the beginning of the message, you can automatically wrap it like on the gif below.

There are also a few keyboard shortcuts we can use to be more productive:
- ctrl+alt+L (L like log) — main shortcut that puts a console.log below,
- alt + shift + C (C like comment) — by pressing this combination you can comment out all console.logs inside a file.
- alt + shift + U (U like uncomment) — uncommenting all console.logs.
- alt + shift + D (D like delete) — deleting all console.logs from the file.
6. Be creative, add your own console methods
You can easily add your own methods and use them in your projects, just get creative and remember that it is meant to help you be more productive. You can create a console.yolo method which will for example… see for yourself!
JAVASCRIPT PRO TIP:
— Develobear 🧸 (@thedevelobear) February 11, 2019
Override console.log() and don't tell anyone in your project you did that. Satisfaction guaranteed 😅
(play with sound 🎧) pic.twitter.com/lWaG0BATFB
Code example
|
|
Hey, one more thing. I’ve created the graphics with the help of www.vecteezy.com
